16 Geoprocessing Tools To Use In GIS Homework Like GIS Pro
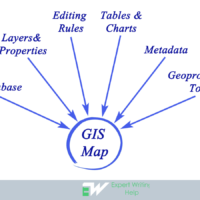
GIS involves utilization of tools in the GIS software to manage and analyze geographic(spatial) data. It mostly involves collection of data, processing and interpretation with an aim of creating maps. Other than possessing problem solving, team work, excellent communication and strong analytical skills; GIS Analysts must have knowledge of some basic geoprocessing tools.
Are you a student or newbie in using GIS software and would like learn to geoprocess like an expert GIS analyst? Well, you are at the right place. In this post, we have compiled an ultimate list of top 16 geoprocessing tools that GIS analysts at our GIS homework help service do use most.
You will learn basics as well as most common ways of processing GIS data that include clipping, buffering, merging, intersecting among others. Our comprehensive list of geoprocessing tools include tools that can be used in ArcGIS and QGIS softwares.
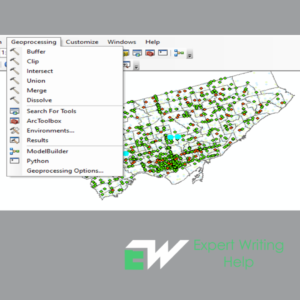
Geoprocessing tools are very essential when one wants to execute a certain analysis using the GIS software such ArcGIS or Qgis. Some of the most common geoprocessing tools that every GIS Analyst should know:
- Buffer tool
- Clip tool
- Merge Tool
- Dissolve tool
- Intersect Tool
- Union Tool
- The erase (Different) tool
- Spatial join tool
- Extract by Mask Tool
- Clip Raster Tool
- Extract by attributes tool
- Reclassify
- Project tool
- Near
- Calculate by Geometry
- Near
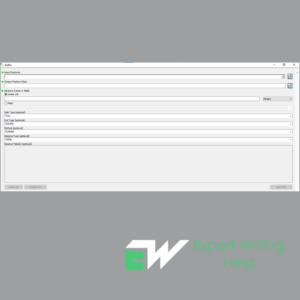
Buffer geoprocessing tool
This is a reclassification process based on distance inside or without a certain closeness. The output are normally polygons around input features at a given distance. Buffer geoprocessing process works in two ways: Euclidean and Geodesic.
Euclidean measures distances in 2D (Two-Dimensional) cartesian plane whereby the distances are calculated between two destinations on a cartesian plane (flat surface). It is ideal in analyzing distances around polygons that are focused in quite a small area.
Geodesic buffering calculates distances between two location or points on a geoid surface. The methods applied determine the kind of buffers created.
In ArcMap buffering can be performed through the following procedure: Click edit tool followed by clicking the feature where buffering is to be created around> click editor menu and then buffer> type the desired distance in map scale units> Select the target in which the new feature will be created> click ok.
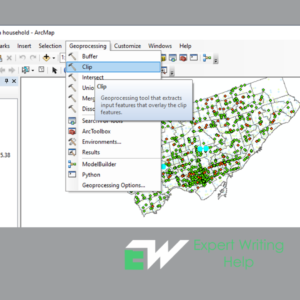
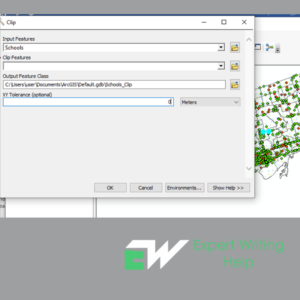
Clipping geoprocessing in ArcGIS
This is creating a subset dataset from a larger dataset through cutting out a section of a certain dataset using a section or multiple of the features in another dataset. The clipping process is useful in choosing an area of interest or study area during spatial analysis. The clipping layer is always a polygon whereas the input layer can either be a polyline, points or polygons. Clipping can be performed both on vector and raster datasets. For Raster dataset, clipping is done using either graphics, data frame or polygons.
Clipping geoprocessing is as follows:
The first step involves clicking the edit tool on the editor tool bar
Step two involves selecting the features to be clipped
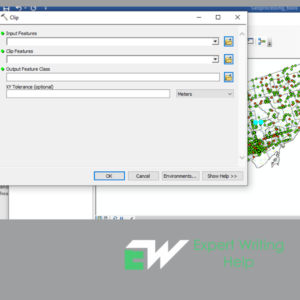
Step 3 involves typing the input features, output features and the tolerance value. Click the type of clipping operation whether to maintain or discard, then Ok.
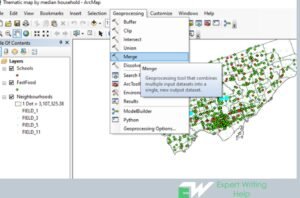
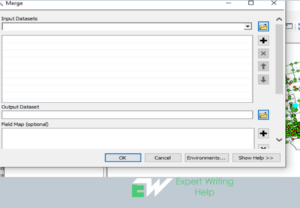
Merge Geoprocessing Tool
Merging in ArcGIS involves combing chosen features of the same layer or multiple layers into a new single feature. The feature must be either from a polygon or a line layer. In addition, also data sets must be from the same data type. The selected feature can either be modified or preserved.
Merging process in ArcMap involves the following process: Clicking the edit tool bar followed by clicking the features you would like to merge. Click the merge tool then click the feature the features will be merged into and finally click Ok to execute the process.
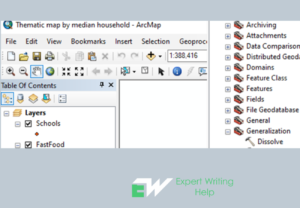
Dissolve Geoprocessing tool
Dissolving tool generalizes and simplifies boundaries from a more complex to a simple. In most cases this tool adjacent edges on a common attribute values basis. The edges(boundaries) will melts into one only if the neighboring polygons share the similar dissolving attribute.
In ArcMap, dissolving tool can be accessed in the data management tool in the generalization toolset. It involves setting the fields that you would like to dissolve. To perform the dissolving geoprocessing: Click Arctoolbox> data management tool > Generalization > Dissolve > double click it. In the new window pane that appears > input files > output files will be selected automatically > Dissolve > Ok.
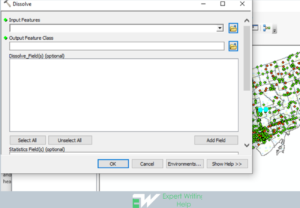
Intersect Tool
This tool calculates a geometric connection of the input features. In most cases, percentages or features of the feature that overlay in all layers or feature classes will be inscribed to the output(product) feature class. While performing this analysis it is advisable that the input features simple one like point, polygon or polyline.
To perform this analysis in ArcMap, go the toolbar > geoprocessing > intersect > enter the input feature, out put feature class, join attributes, tolerance attribute, output type > click Ok.
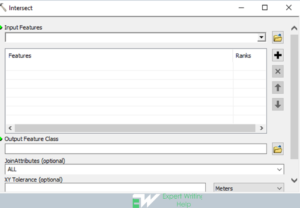
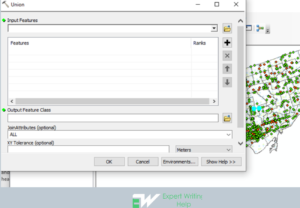
Union Geoprocessing Tool
The Union geoprocessing performs calculation of geometric union of whatever number of feature layers and classes. All input feature layers or classes must polygons in order for the output feature class to comprise polygons representative of geometric union of all involvements as well as the all the fields from all the input feature classes. Furthermore, union tool controls the spatial reference, clusters and cracks the features, determines geometric relationsamongst features from all feature classes and inscribes new features to the output.
To perform Union geoprocessing in ArcMap: Go to geoprocessing > navigate to union > click union > input the features > click Ok to execute the analysis.
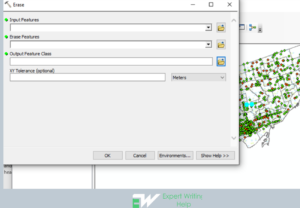
Erase Geoprocessing Tool
Erase tool generates a product feature class by overlapping the input features with the erase features. Only those percentages of the input features falling exterior of the erase features are copied to the product feature class.
To carry out erasing geoprocessing in ArcMap: Go to geoprocessing> navigate to search > type and search erase geoprocessing tool > Enter input features > enter erase features > enter output feature class > enter tolerance > click Ok to execute the analysis.
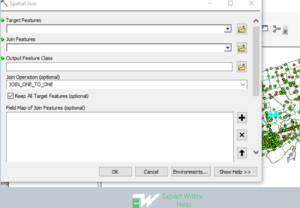
Spatial Join Geoprocessing Tool
This tool joins attributes from one feature to another grounded on the spatial connection. The target features and the merged attributes from the combined features are inscribed in the product feature class. All attributes of the merge features are added to attributes of the target features and cliched over to the output feature class. In the process attributes to be written to the output can be defined.
Spatial join analysis can be carried out in ArcMap as follows: Click on the geoprocessing> navigate to search > type spatial join tool > click the tool > enter the target feature, join features, click Ok to execute the analysis.
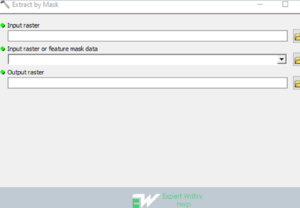
Extract by Mask
This is a spatial analysis function that extracts the cells of a raster that correspond to the areas defined by a mask. Attributes from the input raster will be carried over to the output raster attribute table.
To perform extract by mask analysis in ArcMap, the following steps are followed: Click the geoprocessing and navigate to the search > type extract by mask > click the tool> input the Raster data, input the feature mask data, enter the output raster > Click Ok to execute the function.
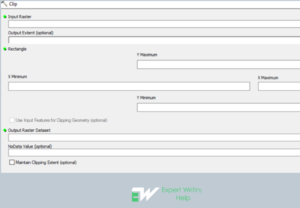
Clip Raster Geoprocessing
The Clip Raster tool permits the extraction of a percentage of a raster dataset on the basis of a template extent. The clip product comprises of any pixels that interconnect the template extent.
Clip Raster geoprocessing is carried out in ArcMap as follows: Enable image analysis Toolbar > image analysis > select the Raster to clip > enter polygon boundary to clip to > Click clip icon > click save to export Raster.
Extract by Attributes Geoprocessing
This function involves extraction of the cells of a raster on a logical query basis. Attributes from the input raster dataset are normally passed over to the product raster attribute table. Liable on the property presence documented, part of the attribute values may require to be recalculated.
In ArcMap, extract by attribute analysis can be performed as follows: Click on geoprocessing > Navigate to search and type “extract by attributes” > Navigate to the tool > enter input raster, enter the “where value cluster”, enter the output raster > click Ok to perform the analysis.
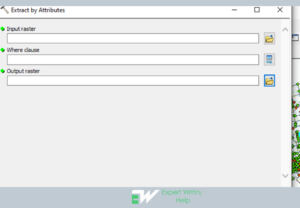
Figure 15: Showing the extract by attributes geoprocessing.
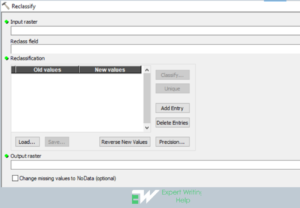
Reclassify geoprocessing tool
Reclassify tool deals with values in a raster. The tool reclassifies the values in a raster. It uses some parameters such as “classify or unique” generates map based on the values of the input raster dataset.
Reclassify geoprocessing can be performed as follows in the ArcMap: On the geoprocessing navigate to search > enter “reclassify” > click on the tool analysis > enter the input raster, enter the reclass field, enter reclassification (whether unique or classify), enter the output raster > click Ok to execute the function.
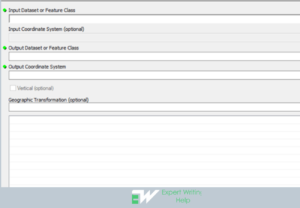
Project Geoprocessing Tool
Project geoprocessing tool is useful in projecting spatial data from one coordinate system to another. To perform this in the ArcMap, the following steps are followed: Go to Arctoolbox > Data management > projection and transformation > project > enter the input dataset or feature class, output dataset or feature class, output coordinate system > Click Ok to execute the function.
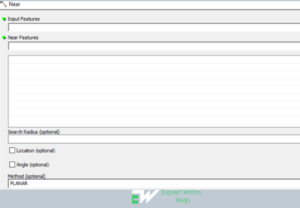
Near geoprocessing Tool
Near(analysis) tool helps the GIS Analyst to compute distance and extra nearness info between the input features and the nearby feature in another layer or feature class. To perform “near analysis” in ArcMap, the following steps are useful: On the geoprocessing navigate to the search > type “near analysis” > On the appeared tab enter the: Input features, near feature, enter the method and click Ok to execute the function.
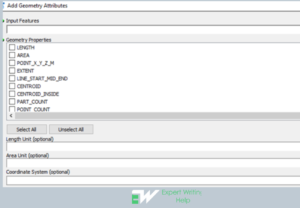
Calculate by geometry geoprocessing tool
Calculate by geometry can be utilized by any GIS analyst when they want to add info to a feature’s attribute fields in place of geometric features and location of each feature like area or length, elevation and x-y coordinates.
To carry out “calculate by geometry” in ArcMap, the following steps can be followed: go to the geoprocessing and navigate to search > click and type “calculate by geometry” > click in the “add geometry attributes”> enter input features, geometry properties, length unit, area unit > click Ok to execute the function.
References
Introduction to arcgis pro (no date) Introduction to ArcGIS Pro-ArcGIS Pro | Documentation. Available at: https://pro.arcgis.com/en/pro-app/latest/get-started/get-started.htm (Accessed: April 3, 2023).

 With scientist working around the clock to minimize the spread and also try and get a cure for the novel disease, Corona Virus, or as many of you will call it, Covid-19, they need help from every available channel and geographical data analyst have risen to the task once again to help and show them in a simplified version how the virus is spreading. So what is GIS technology? What is its relevance in relation to the Corona Virus? GIS technology is basically the collection, analyzing, manipulation and representation of spatial and geographic data as deemed relevant according to the set criteria. In our previous segment, we analyzed a couple of software that have been tested and proven time and again to be the best GIS program every GIS analyst should learn. However, amid this pandemic, how do these systems help us and what role are they playing in making sure that the human race overcomes this terror? Well, this is how. Our
  The world health organization is at the front line in helping fight this pandemic and they are doing the best they can in collaboration with both the affected countries and those that are not yet infected. Having in mind that they have this tasks in hand, they have also adopted a GIS system that assists them to get live updates of what is happening in terms of the cases being reported all over the globe. They are able to update their systems every 15 minutes with the latest news in terms of the spread and research on Corona Virus. GIS analysts have come up with a global map that shows the extent to which every country has been affected by the virus. However, the good thing is that they do not reveal the specific identities of the affected individual.