Terminologies Used in Statistics

Terminologies Used in Statistics

statistics terminologies Data analysis and statistics have been around for the longest time and their contribution has been immense in every field, after all, every time there is a need for research statistical data to be employed and data analysis techniques brought into play. Just like in any other field, a statistical lingo had to be birthed and this means that all you need to mention is one word and you know what is needed. Statistics is not a walk in the park and if you’re not well versed with the statistical lingo, then you will neither be part of the conversation nor will you follow what is being said. But let that not be a problem for you, I’ll walk you through a couple of commonly used statistics terminologies.

  • Data set – Data sets describe values for each variable for quantities such as height, weight, temperature, volume, etc. it involves grouping the said data.
  • Skewness – This is the degree of asymmetry observed in a probability distribution. Skewness is normally observed from a graph and there can be one of three outcomes; positive skewness (to the right), negative skewness (to the left) or zero skewness
  • Kurtosis – Kurtosis is used to describe the level of peakedness of a frequency distribution. In describing the type of peak, there are three terminologies used i.e. Leptokurtic(high peak), mesokurtic(mid peak). Platykurtic (low peak)
  • Probability- this is generally used to describe the likelihood of the occurrence of an event.
  • Mean – this is the summation of all entries in a data set divided by the number of entries in the data set.
  • Mode- This refers to the most repeated value in a data set.
  • Median-this refers to the middle value in a data set. Can be derived from both even and odd values of data entries.
  • Standard deviation- The most commonly used measure of the spread of a set of observations. Equal to the square root of the variance.
  • Cumulative frequency distribution: The tabulation of a sample of observations in terms of numbers falling below particular values.
  • Average: Most often used for the arithmetic mean of a sample of observations, but can also be used for other measures of location such as the median.
  • Confidence intervals: It is a value that combines standard error and sample statistics to predict population parameters.
  • Standard errors: It is variability of sample mean.
  • Alpha factoring: A method of factor analysis in which the variables are considered samples from a population of variables.
  • Class- a grouping of values by which data is binned for computation of a frequency distribution
  • Data fusion: The act of combining data from heterogeneous sources with the intent of extracting information that would not be available for any single source in isolation
  • Bell curve- a graph depicting normal distribution with a high average and entries on both extremes and is similar to a bell in shape.
  • Coefficient of variation- a measure of spread for a set of data.
  • Time series analysis: It is a statistical procedure of analyzing data points indexed over time.
  • Alternative hypothesis: Theory that contradicts null hypothesis
  • Null hypothesis: This is informed assumption whether your statistical assumption is true
  • Analysis of covariance: This is a statistical tool that evaluates differences in means of effects or dependent variable related to the effect of the controlled independent variable while observing the effect of the uncontrolled independent variables. The analysis is more accurate and unbiased.
    Analysis of variance: This is a statistical tool that compares variances across means different groups.
  • Covariates: This is a continuous variable that influences the dependent variable but it is not of interest in the study
  • Causation- this implies that the occurrence of an event is dependent on the occurrence of another event.
  • Inferential statistics- This refers to data analysis in an effort to make conclusions from given data.
  • Descriptive statistics – A general term for methods of summarizing and tabulating data that make their main features more transparent.
  • Differencing: A simple approach to removing trends in time series
  • Sample size: The number of individuals to be included in an investigation. Usually chosen so that the study has a particular power of detecting an effect of a particular size
  • Population- it is the general group which a sample is taken from to give information on the whole group.
  • Frequency distribution- describes how many times an event is repeated. Or the number of times an occurrence is repeated.
  • Outlier: It is commonly referred as extreme of data points.
  • Venn diagram- A graphical representation of the extent to which two or more quantities or concepts are mutually inclusive and mutually exclusive.
  • Graphs- this is a diagrammatic representation of data normally on a horizontal and vertical axis that represent various sets of data for comparison purposes. There are various types of graphs depending on the purpose of the graphs.
  • Histogram- A graphical representation of a set of observations in which class frequencies are represented by the areas of rectangles centred on the class interval. If the latter are all equal, the heights of the rectangles are also proportional to the observed frequencies.
  • Scatterplots: This a visualization tool that plots two continuous variable
  • Break-even point- this is basically termed as the point where the total revenue is equal to the cost incurred hence profit at BEP is usually zero.
  • Quartile- The values that divide a frequency distribution or probability distribution into four equal parts.
  • Regression- This is a statistical technique that serves as a basis for studying and characterizing a system of interest, by formulating a reasonable mathematical model of the relationship between a response variable, y and a set of q explanatory variables, x1; x2; …xq.
  • Stem and leaf diagram- A method of displaying data in which each observation is split into two parts labelled the ‘stem’ and the ‘leaf’. With the stem as the common figure in the data set and the leaf as the unique figure.

These are just some of the most commonly used statistics terminologies; however, there is so much more that you need to learn to achieve guru status in statistics. Also, consider studying different statistical laws and the people who coined them. To top it all up, statistical formulae is extremely crucial to your statistical knowledge foundation.

The article has been prepared by our trained statistician. He has published numerous articles on data analysis.

See below links

How To Code and Enter Data in SPSS

R vs STATA vs SPSS

How To Choose Statistical Tests

Article written by Ngari Ngunjiri 

R vs STATA vs SPSS

Comparison of R Studio vs STATA vs SPSS

R vs SPSS vs STATA
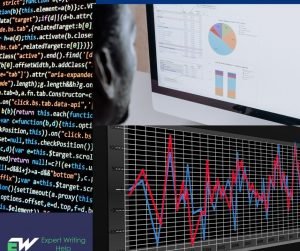
As a data analyst, either in practice or still a newbie, learning the ropes in data analysis, you have to know your tools of work. Data analysis is a whole process that could be as simple or as complex as you want it. It basically entails the systematic application of statistical and logical techniques to evaluate data. You go to work using a certain route and every day by half-past seven there is always traffic, then with this data, you are free to make a decision to choose another route after you take into consideration all that you know. This is the basic application of data analysis in day to day life. However, taking this up a notch, data analysis is used on a large scale to make strides in science, economics and pretty much any other aspect of life. However, analyzing large data need you to use the best tools there is.

If you are here then I bet that you have heard of STATA, R and SPSS and are probably wondering, what is the difference between them and what are the pros and cons behind each of them and even more importantly which is the best for me. Well, you are in the right place as I intend to give you all the answers that you seek. For starters, these are three different tools that are aimed at doing the same kind of work but have different specs to them and are tailored differently. They differ in user-friendliness, the scope of work they can accomplish, their capacity and many other differences that I will be sharing with you. To get a good insight into them, let’s step into their arena and get to learn about them more.

R

R came into play in the mid- 90s from Ross and Robert and this explains why they choose R as the name of their product. It gained popularity over time as a very user-friendly and well-tailored data analysis tool. It is very effective in designing statistical models to solve complex statistical problems. Notably, R is free open source software, therefore, it is compatible with any operating system. Besides a point and click user interface, the program has command line and savable files that gives it ability to engage matrices, vectors as well as delineate aesthetic graphs and make it easy for users to interact with them all thanks to its graphical library.

  • R is very good for data analysis
  • Complex for beginners
  • Facilitates interaction with databases
  • It supports a variety of extensions
  • Proper organization of data in columns and rows
  • Has a variety of tools such as scatterplot 3D and high charter or data science application
  • Constant update of the system
  • It is ideal for data wrangling
  • Steep learning curve
  • Free open source software

STATA 

STATA is a statistical software used in data analysis that enables users to analyze, manage and graphically represent data in a more meaningful way that allows them to make inferences as well as draw conclusions. Among the many reasons why people prefer to use stats are ;

  • STATA is easy to learn for beginners and easy to use as well
  •  it is supported by a wide range of introductory textbooks
  •  it is well-controlled by STATA Corp so that one can have real faith in STATA ’s results
  •  using STATA really does help students to learn about statistics
  • it offers a wide range of statistical analyses
  •  it has a great degree of flexibility
  •  it presents results in a clear format

When dealing with a data analysis assignment one of the very first thoughts you will have is, which is the best software for me to use in data analysis? And truth be told, you will wonder whether or not you will be able to deliver on your project. Well, I cannot assure you that you will deliver but I know people who will, You can contact us for data analysis help using R, STATA or SPSS. These are the guys for the job. With years of experience handling project after project, then you can be sure that our writers have an up to date database on all that you may need. This cuts across the board, right from choosing the right topic ideas for you, having the right structure for your paper, driving a valid argument for your case and most importantly giving you an authentic, original project. Have I mentioned that we have a 99% success rate in our work and this is the kind of thing you should look for before you decide on who you want working with you?

You are probably wondering, ‘with this kind of record and delivery, you guys must be charging a fortune.’ Well, you can put that thought aside and save some cash working with expert writing help services, thanks to unimaginably affordable deals and you get a free ‘side dish’ of free, unlimited reviews as well. And to show you that we do not compromise on our quality, we let you in on the progress through our 24/7 open customer care line, if that is not quality, then I don’t know what is.

 SPSS

SPSS was created by SPSS Inc and later in 2009 was acquired by IBM Corporation and renamed IBM SPSS Statistics Package. SPSS is abbreviated from the statistical package for social sciences. The software contains a statistical analysis and toolpak for easier statistical analysis and open source integration. and SPSS has earned its spot in the market over time and has for the longest time dominated thanks to top-notch features.

  • Supports data from multiple sources
  • Ideal for large amounts of data
  • Better for multivariate analysis
  • Works better in social and medical sciences
  • Best for complex data sets
  • Has a direct generation of output for reports
  • Ideal for forecasting and decision trees
  • Advanced statistics and charting capabilities
  • Custom tables add on package

You are probably wondering, is there any specific reason as to why I have ranked them in this order? Well, yes there is and I will prove that to you on a head to head comparison of these statistical analysis programs.

  SPSS


STATA


Used in medical and social sciences areas


Used mainly in economics and econometrics


Mostly suitable for complex data sets It is not very good for complex data analysis
 

It is mostly used for small data and in its application


It has its application in large scale and cutting edge research

Performs muitivariate analysis for large dataset Performs normal statistical analysis
Generates outputs into reports Uses a command line and documentation features
Performs modeling on complex data Not suitable for complex analysis and modeling
Excellent for data management Ideal for researchers


Verdict

Choosing the software to use is an uphill task more so if you are a newbie or student. Unfortunately you will need to interact with the software themselves, however, this overview will give you an idea of what you are looking for so as to look into it in depth. After all, the best way to know what you want is to get a personal feel of it.

I would recommend that social science students looking for a friendly program for statistical analysis for dissertation i do recommend SPSS.

If you are looking to advance in statistics and learn to perform complex statistical analysis and statistical modeling we recommend you learn R programming language. It is versatile and can perform complex statistical analysis on large datasets.

Economics researchers and econometrics students keen to learn on economic model development and testing should be keen to learn STATA.

Related Links

https://expertwritinghelp.com/blog/2019/02/06/statistical-tests/

https://expertwritinghelp.com/blog/2016/09/03/how-to-code-and-enter-data-in-spss/

How To Choose Statistical Tests

How To Choose Statistical Tests To Use in your Dissertation or Capstone Project

Are you a nursing student worried how you will analyze data for your DNP capstone project or dissertation paper? We would like to present to you a comprehensive tutorial on how to choose statistical tests for your dissertation project. In case you get stuck feel free to consult our SPSS data analysis help service

Most people can handle descriptive statistics without issues. But when it comes to inferential statistics, few people exude total confidence. But with the right statistical tests , inferential statistics does get a little easier. This post explains how to choose statistical tests that deliver high-quality findings.

Statistical analysis and testing are somewhat complex but very useful processes. They help researchers and analysts convert tons of raw data into useful information. If you don’t have a grasp of these procedures, you likely won’t see great results.

Before you dive into how to choose statistical tests for your study, study the distribution of your data. You also should spend some time extracting descriptive statistics from the data. In other words, you should calculate the mode, median, and mean. Doing that does make drawing inferences from your data somewhat easier.

What Factors Determine Which Tests You Should Select?

There are a plethora of statistical tests out there. Unsurprisingly, choosing the most fitting statistical test (s) for your research is a daunting task.

Three factors determine the kind of statistical test(s) you should select. These are the nature and distribution of your data, the research design, and the number and type of variables.

Here’s a little general advice on picking statistical tests. If your data is “normally distributed,” it’s best to use parametric tests. But if your data isn’t normally distributed (“non-normal” data), you should go with non-parametric tests.

9 Common Statistical Tests and How to Pick the Right One

Before you pick any particular statistical test, ask yourself: what do I want to do with my data? What do I want to know? After that, pick the statistical test that’s designed specifically to support the execution of that action.

Here’s a list of common statistical tests and what they’re best for so you can pick the best bet for your analysis.

Sign tests

Use the sign statistical test to study the difference between two related variables. This statistical test pays little attention to the magnitude of change in the difference (if any). However, the test factors in the direction of the difference between the variables in question.

Wilcoxon rank sum test

The test focuses on the difference between two variables that are independent of each other. It takes into consideration both the direction and magnitude of the difference between the variables.

Wilcoxon sign rank test

The Wilcoxon sign rank test is used to test the difference between two related variables.

ANOVA

This statistical test helps data analysts to test the difference between group means. Note: You shouldn’t run ANOVA before you’ve accounted for all variances in the outcome variable.

Paired T-test

The Paired T-test helps analyze the difference between the means of two related variables.

Independent T-test

The Independent T-test is the exact opposite of the Paired T-test. This test deepens the analyst’s understanding of the difference between the means of two independent variables.

Pearson correlation test

The Pearson test is a correlational statistical test. It enables you to accurately determine if any statistical association exists between two continuous variables.

Spearman correlation Test

The test is similar to the Pearson correlation test in that it’s a correlational statistical test. The test helps you to describe the association existing between two ordinal variables.

Chi-Square test

The Chi-Square test measures the strength of the association that exists between two categorical variables.

Multiple regression test

The test tracks how change in multiple predictor variables (2 or more) predicts change in the outcome variable.

Single regression test

The test tracks how change in one variable (predictor variable) predicts change in another variable (outcome variable).

You now know what each of 11 common statistical tests measure. At this point, picking the right test for your study should be pretty easy.

Statistical Tests For Inferential Analysis

You’ve learned what various statistical tests do. Which means you can easily know how to choose statistical tests that are suitable for your research. But you probably haven’t mastered any of the tests, have you? Obviously, you can’t leverage the power of any of the statistical tests if you don’t know how they work. Also, you should learn how to use statistical analysis software packages such as SPSS and MATLAB work. That’s because statistical tests and statistical software work hand in hand.

Infographic on how to choose statistical tests

how to choose statistical tests

Source: https://www.minds.com/media/939916680893247488

Video on how to choose statistical tests

Source: https://youtu.be/rulIUAN0U3w

Statistics Major Job Opportunities

Why Study A Major In Statistics?

Hot Careers and Future Job Outlook for Statisticians

statistics major job opportunitiesIf you’re a data geek, you’re assured of job security, at least for the next one decade. For the last 15 years, there has been an increasing demand for statisticians. According to BLS (The Bureau of Labor Statistics), this growth is not about to relent.

BLS projects that from 2016 to 2026, employment for statisticians will grow by 34%. This is huge compared to the 28% growth in mathematical science occupations and 7% in all occupations. Statistician’s rank 9Th on the list prepared by Labor department of 20 fastest growing occupations.

Out of the 10 jobs BLS forecasts to grow fastest in the next decade, it’s only app developer and statistician that are not in the healthcare field.

What is fueling the growth?

There is a growing appreciation of statistics – The science of gleaning insights from data, and measuring, understanding, and controlling uncertainty – by governments, nonprofit organizations and businesses.

With the web and the ever-growing computing power, the world is producing more and more data that can be used to generate scientific and business insights. This increased availability of data is fueling the need for more data geeks – numbers won’t crunch themselves.

By 2025, IDC, a research firm, expects the amount of data created yearly to be 10 times more than the data created in 2016. That makes ‘statistical analysis and data analysis’ one of the hottest skills to have. And according to Linkedin, it’s the second most important skill that employers are looking for in 2018.

Increasing wages

The huge demand for data experts has led to a surge in wages for statisticians. Based on BLS data, between 2000 and 2014, statisticians’ mean wage grew by 12%. For most workers, wages in this period either dropped or stagnated.

By 2016, the median annual income for statisticians was $80,000, and it’s growing. Students are noticing. Between 2015 and 2016, the number of undergraduates in the US majoring in statistics rose by 19%. But according to American Statistical Association, the rise is hardly enough to meet employer’s demand.

Expanding university statistics programs

Universities are also responding to the increasing demand for data experts by expanding their statistics programs. Between 2003 and 2014, the number of universities offering degrees in statistics went up by 50% for undergraduate programs, and 20% percent for masters programs. There was an even bigger growth in master’s and doctorate programs, between 2000 and 2014, the number of programs increased by 160% and 130% respectively.

Also, several universities, for instance, the University of Washington, Kennesaw State University, the University of Michigan, the University of California, and the University of Washington, have now established Data Science programs.

Hot Career Opportunities For Statisticians

The job growth for statisticians is impressive, but still, it under reports the number of opportunities available to data experts. Jobs such as market research analyst, data scientist, and actuary, demand proficiency in statistics. Hundreds of thousands of statisticians work in this jobs.

Here is a list of career opportunities in statistics

Market Research Analyst

Market research analysts use specialized software to analyze ‘market data’. They gather and break down complex data on consumers, competitors, and market conditions. Their role is to take difficult data sets and translate them into easily understandable graphs, tables, and reports that can be used by people with little expertise in statistics.

Data comes from a myriad of areas, including interviews, web analytics, surveys, and literature reviews. To become an analyst, you need a bachelor’s degree, but some positions require a master degree.

Statisticians

A statistician’s job is to prevent inaccuracy in the interpretation of data. Statisticians design surveys, experiments, and questions. They then gather data through various methods for analysis and observation. After careful analysis, they present findings in an easily understandable form. Statisticians also explore new ways of collecting data.

Thanks to the massive amount of data that’s now available to organizations, there is an ever-growing need for statisticians.

Brand Optimization Analysts

Like all statistics-driven careers, brand optimization analysts study data and examine trends. Once they’ve noted trends, analysts suggest changes to business goals and develop strategies to maximize the reach of their brands.

To get into this career, you need a bachelor’s in finance, mathematics, marketing, economics, statistics or computer science.

Operations research analyst

list of careers in statisticsOperation research analysis taps into information from every aspect a business: sales data, customer feedback, web analytics, and computer databases. The analysts then use statistical tools to analyze this information and craft solutions for key decision makers.

A collaboration between the management team and operation research analysts is key to keeping a business profitable and functional. At the entry level, you can get in with a bachelor’s, but senior positions require a master’s degree.

Data Scientist

Data scientists dig through data looking for trends that point to the ‘next big thing.’ To become a data scientist, you need data gathering and analysis skills. Businesses use data science to develop and launch new offerings.

To get into this career, you need a bachelor’s degree, in math, statistics, physics, engineering, or computer science.

Financial analyst

Financial analysts focus on evaluating of past and present financial data. They look into business and economic trends and work with company officials to project the company’s financial future. Analysts typically specialize in industries, types of products or world regions.

To get into an advanced position, you need a master’s degree, but there are opportunities even you have a bachelor’s degree.

Biometrician

data analysis helpA biometrician’s job is to study trends that point to the probability of phenomena or specific conditions occurring. Their findings bolster quality control in field projects as they allow colleagues to anticipate and plan for various scenarios.

To become a biometrician, you need a master’s degree in zoology, wildlife biology, ecology or statistics.

Data scientist or statisticians combine math skills and excellent computer skills to gather and analyze data, with which they craft accurate and insightful reports that businesses use to develop plans and achieve goals. Employment opportunities are plentiful in multiple industries, providing data experts with lucrative, challenging and rewarding careers.

Did you know that expert writing help offers SPSS data analysis help for dissertation to students in need of statistician. Enhance your employ-ability by proving to prospective employers that you possess excellent quantitative skills. Our statisticians will assist you write methodology section for your dissertation, thesis or research paper.

Moreover, expert writing help is the website to run to in case you require data analysis assignment help or  any other form of academic writing service

How to Code and Enter Data in SPSS

How to Code and Enter Data in SPSS

learn how to code and enter data in SPSS
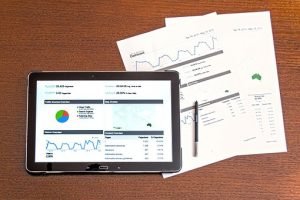
Data analysis involves running raw data in a statistical program to obtain results. Analysis can only be done after you code and enter data in SPSS.

Statistical methods such as descriptive statistics and inferential statistics aid a researcher understand data patterns. Normally statisticians use SPSS, SaS, STATA, S-Plus, R GUI and MS EXCEL to conduct statistical and mathematical analysis. The selection of a package depends on familiarity and simplicity of a program to the user.

SPSS stands for Statistical Package for Social Scientists; the package is mostly used by non-statisticians due to its simplicity. It has a graphical user interface that makes it friendly to users with little programming language. This is unlike other packages like R and SaS that are command oriented and require users to be conversant with statistical equations modeling. Before running analysis using SPSS a user need learn how to code and enter data in SPSS system

In SPSS, the first step involves defining the names and inherent traits of the variable. This is followed by entering values into each defined variable. Each row and column represents source of data and characteristics of the measured data respectively. In case, you wish to add variables after entering data, you just need to define new variables in the variable view. Go to variable view, click an empty row and start defining variables as stated below.

Code and Enter Data in SPSS Like an Expert

affordable SPSS data analysis helpBefore you run an analysis in SPSS, you will be required to code and enter data in SPSS. The process is so simple that you can do it within 10 minutes even for large data-sets.The process of coding data is described below:

Go to variable view, click an empty row and start defining variables as stated below.

  • Name: SPSS requires that each variable to be unique, and contain a maximum of 8 characters.
  • Type: There are eight types of variables to be found in SPSS that include numeric, comma, dot, scientific notation, date, dollar, custom curency and string. To select variable type, click in the cell on the grey box.
  • Width: This refers to the number of characters to be inputted for the variable.
  • Decimals: This is the number of decimal places to be displayed by the program
  • Label: This is a string of text that explains in details what a variable represents. You can enter a maximum of 255 characters containing spaces and punctuation marks.
  • Values:  In case of categorical data, you need to specify which numbers represent which category. For example when coding gender in SPSS you can let 1 represent male and 2 represent female. This can be seen in the data view by clicking the toe tag icon. On clicking the tag it switched between numeric values and their labels.
  • Missing: This entry in the variable view signals to the program that data is missing. You need to assign figures to be missing values. Like by assigning 9,99 and 999 as discrete missing vales. SPSS would treat these figures as missing and ignore the values.
  • Measure: This property indicates level of measurement of data source. The three measure properties include scale, ordinal and nominal. Interval and ratio levels of measurement are grouped as scale measures.

Once you are done with coding data, you can enter data values in the data view screen. This will be followed by data analysis depending on what you wish to achieve.

Code and Enter Data in SPSS To Begin Statistical Analysis

expert SPSS data analysis helpThere are two types of analysis namely descriptive and inferential analysis. Descriptive analysis seeks to study frequency and features exhibited by the data.

The most common descriptive statistical methods include measure of central tendency and measure of dispersion. These statistical measures are presented in the form of frequency tables, pie charts, histograms and boxplots. These tables and charts summarize data and scale variables.

Inferential analysis goes further to study how variables in a data set relate with each other and forecasting outcome. Survival analysis, modeling, regression, factor analysis, discriminant analysis, time series and categorical tests are some of the inferential statistical methods. Besides researchers, inferential statistical analysis are widely being used by data scientists in studying data patterns and predicting future outcomes.

In case you are any problems, get in expert data analysis help in SPSS from our SPSS experts online.