How To Create Map in ArcGIS Pro
GIS involves utilization of tools in the GIS software to manage and analyze geographic(spatial) data. It mostly involves collection of data, processing and interpretation with an aim of creating maps. Other than possessing problem solving, team work, excellent communication and strong analytical skills; GIS Analysts must have knowledge of some basic geoprocessing tools. Geoprocessing tools are very essential when one wants to execute a certain analysis using the GIS software such ArcGIS Pro.
Map making mostly involves defining the core theme of the plan, defining type of map chosen to convey the theme, detecting the target audience and framing the finest way to organize, merge and configure the features to efficiently communicate the map’s intended message.
Map making in ArcGIS Pro involves five steps, namely:
- Preparation
- Mapping
- Labelling
- Layout
- Proof checking
To minimize errors, the analyst must follow these steps chronologically without skipping any step.
Step One: Preparation
This is the most important in map making as it lays the foundation on the kind of output(map) that will be generated. It gives a room for the analyst to decide:Where they are going to map? What kind of scale and extend they will apply? Setting and choosing appropriate zone and coordinate system.
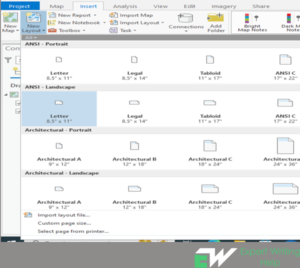
Firstly, Start the Software (ArcGIS Pro) and sign in. Move the cursor to the start page and click open another project, create a new layout guided by the chosen dimensions hence printing won’t be problematic. To do this, move the cursor to “new layout icon”, click and navigate to your desired size to be printed. Secondly, the empty map should be added to the layout and setting its position and size. The next step involves activation, panning and zooming of the map to desired extent and scale. To activate, in the contents pane, right click the map frame and click activate.
In addition, open the map properties and apply the set scale as a reference scale, insert a layer template, save the edits and close the map activation. Final step preparation stage involves downloading data enclosed by the defined extent and scale: and noting down the source of the data for later reference.
Move the cursor on the ribbon and click view, click reset panes and choose reset panes for mapping. This will make sure catalog and contents panes remain open. In the content pane, right click layout and click properties. On the layout properties icon, click general tab and makes the desired changes by renaming it.
Guides are useful in aligning elements on the layout. To add guidelines, right click the ruler ribbon and click add guides. In the guides dialog box, navigate to orientation and choose both. Navigate again to placement drop down arrow choose offset from edge. Choose your desired value in the margin box and click Ok.
Step Two: Mapping
This step involves adding data into the map as well as removing the unwanted layers as you merge the datasets into a single layer. It is also in this stage that will determine whether you have all the required or need some more datasets. Definition queries can be used to filter out the unwanted data to be displayed on the map.
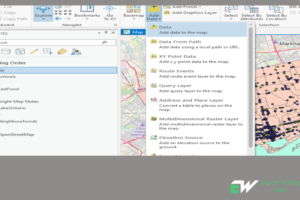
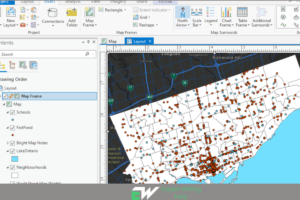
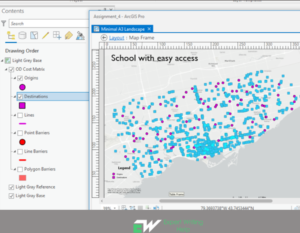
Before adding data to the map, its important to consider the purpose of the map, the accuracy of the data in relation to the message to be conveyed, how dense the dataset is and the age of the data. To add data, move the cursor the “add data” icon, expand and click “add data to the map” > move to where you have saved your data, select the required datasets and click Ok for them to be added in the map as shown in the image 2 &3 below.

The next move will be to create/make a new geodatabase file and exporting each of the layers into it and renaming them with new names. To create a geodatabase, in the catalog pane right click folder and click new file geodatabase. Remove the old layers from the map while keeping the new ones. Now symbolization of the data should be carried out to give it a better look/appearance.
Step Three: Labelling
This step is very crucial in map making as it gives maps better looks. First and foremost, turning on of the labelling should be done for the suitable layers.To turn on labels, choose a feature layer in the content pane. On the feature layer click labelling tab. In the layer group click on label. Secondly, create a different label class for every style of text.Thirdly, keep playing with the labelling properties until they meet your desired appearance. Lastly, convert the labels to annotation and ensure your taste is met through editing.
Step Four: Making a layout
This step involves making a map that will be used as a key. To create a new map, move the cursor to insert icon on the window ribbon and click new map. Firstly, insert a new map and choose a suitable coordinate system. To choose a suitable coordinate system, move the cursor to the map properties, click coordinate tab, click Ok to set the coordinate system. Secondly, add the key map you have created to the layout. Thirdly, create a new layout guided by the chosen dimensions hence printing won’t be problematic. The empty map should be added to the layout and setting its position and size. The next step involves activation, panning and zooming of the map to desired extent and scale. In addition, open the map properties and apply the set scale as a reference scale, insert a layer template, save the edits and close the map activation. Add some more data that can explain to the target audience/reader where in the universe they are looking at. Make appropriate symbols and label for the map.
The next move involves inserting cartographic items. To do this, click insert icon and use cursor to move over and clicking on items that you like to insert to your map. Some of these cartographic items that need to be inserted may include: Title of the map, legend, scale bar, north arrow, graticule or grid, source credits, descriptive text, graphs, charts and pictures.
Step Five: Proof reading
This is also very important stage of mapping that should not be skipped at any cost. This stage allows the cartographer to correct some mistakes they may have made during map making. To do this, ensure all the layers necessary are turned on. First the layout must be exported in pdf format for the errors to be seen and corrected on the map. The process has to be repeated for several time to ensure that all errors are fixed.
Maps can also be created from carrying some spatial analysis. Some the basic of the common analysis may include: Buffering, calculating density by container, carrying out analysis using symbology to classify the data into desired percentages, performing some network analysis such as origin destination cost matrix to determine number of facilities that can be accessed from a chosen point.
To create a map that shows some facilities that can be accessed from a specific point, origin destination cost matrix can be performed. Move the cursor to the analysis tool > move to network analysis tool and click it > import the datasets in the destination, origin and set the desired parameters > click run to execute the analysis. The output will display some destinations and origin points as shown in a final map in image 5 below.
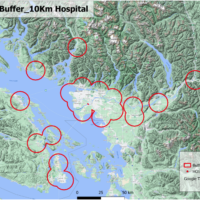
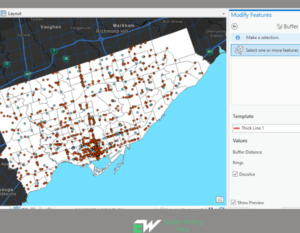
This tool is useful in creating new features around other features. To buffer a feature, click the edit > click modify features. In the modify features expand construct > navigate to buffer and click it. Click the template arrow > choose a template feature > in the buffer box type your desired distance to buffer > in the rings enter the number of multiple buffers > check preview and dissolve as well, also specify the shape of the buffer product > in the pane, click buffer.
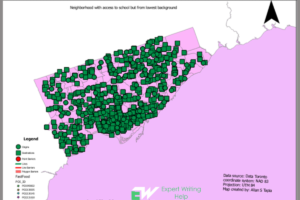
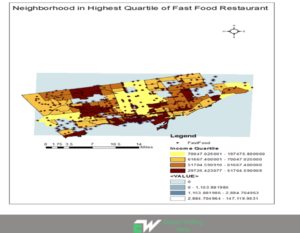
Symbology analysis can also be used to create specific map that classify the data into a specific class. For instance, population data can be classified into upper and lower quartile to create a specific map like the one shown below.
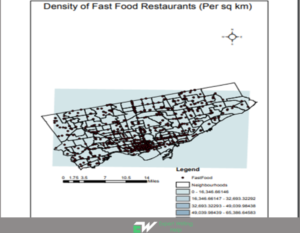
Higher and lower density areas in a dataset can easily be identified through creating an area density map. For instance, in the map below, the density of fast food restaurants in Toronto is calculated using container approach. The output is as shown in image 9 below.
Get Assistance with Creating Map in ArcGIS Pro from Expert ArcGIS Pro Tutors
Are you stuck with gis lab reports that require you to create maps using ArcGIS Pro? then worry no more. Our ArcGIS Pro assignment help will take you through step by step approach to creating well layout maps. Our expert GIS tutors are conversant with exporting maps, creating map layouts and map frames using ArcGIS Pro. You will also get to learn how to create map in ArcGIS Pro from finest analysts and cartographers online