GIS Dissertation Topics in Urban Planning & Management
Are you a GIS student in the United States of America or Canada or United Arab Emirates? Then you need to consider application of GIS techniques in urban planning and management for your dissertation or thesis or capstone project.
In 2025, the role of GIS in urban planning & management can’t be over-celebrated. I mean ~ you’ve heard of the mythical London subway, or spent a lazy afternoon at a public park within your city. All that is resilient GIS urban planning and management at work! For example, Dickinson (Texas) are revitalizing their downtown with an ambitious vertical, mixed-use plan. Know what? some of the GIS expert in such teams sought GIS assignment help to assist with their GIS coursework for four years ~ ask them!
Did you even know the city of Portland (Oregon) is living proof of GIS-aided city planning and management? The initial zoning plan perfectly balances environmental preservation with urban developmental needs. Cool, huh?
So, What is this GIS Thing?
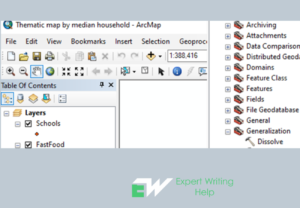
The most student-friendly explanation is “a tool that combines maps with data to solve real-world problems.” Geographic Information System (GIS) quietly changes the inhabited world through precision mapping, modelling, and meticulous geospatial data analysis. The gray-haired urban planner can’t hide their joy ditching the fossilized Computer-Aided Design (CAD) for ultra-modern softwares like ArcGIS and QGIS according to Geo Week News.
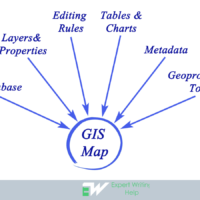
Definition: GIS (Geographic Information System) is integration of various data sources into a single spatial platform enabling specialists to analyze complex relationships, visualize potential impacts, and make informed decisions regarding sustainable urban development, efficient infrastructure projects, and community planning.
(See an abridged list of American universities offering GIS qualifications here).
Why GIS?
The indispensable application of GIS in urban planning presents city planners with powerful data analysis / visualization capabilities for evidence-based decision-making. To counter complex urban challenges, GIS adds value in addressing zoning, environmental management, infrastructure development, and disaster management.
For this reason GIS professionals are highly sought worldwide in development of smart cities and future cities. By focusing your GIS dissertation/thesis/capstone in urban planning and city management you will be setting yourself to success and a high-paying career.
What does it take to succeed as a GIS professional in urban planning?
- Be a graduate from an accredited institution in your region
- Spatial and attribute data for the specific location you’re planning for (Hey, we’ll also help you collect GIS data! (You can hire our GIS assignment writer for assistance)
- Computers and GPS devices fitted with software such as ArcGIS or QGIS.
Benefits of Learning GIS for Students
GIS skills are in high demand across numerous industries, making it a priority value-addition to your academic toolkit. Here are 4 major benefits you’ll enjoy after bagging GIS-related credentials:
● Wider Career Opportunities
Urban planning & management, environmental consulting, private consultancy earning bundles of crisp Benjies in fees, and government institutions are some employers where GIS skills are in very high demand.
● Additional Academic Advantages
GIS can enhance research projects, theses, or dissertations – thereby adding to the existing authoritative literature. This comes with bonus academic advantages such as learning to concisely communicate ideas to an academic (or the general) audience.
● Skill Development
Interactions with GIS softwares gives you technical skills and proficiencies no school will ever teach you. Most trending data analysis tools will intuitively train you in soft skills like critical thinking and data-driven problem-solving.
● Networking
GIS, more than any other discipline, creates exclusive opportunities to connect with urban planning and management professionals. GIS conferences, workshops, and even their online communities are virgin minefields for trending practices, up-to-date tech innovations, and the most recent methodologies.
Expert Writing Help helps high-school graduates to write winning applications for those aspiring to join GIS-related programs. No school has ever turned down our expertly-crafted personal statements and statement of purposes!
GIS Dissertation Topics that Focuses on Urban Planning & Management in 2025
Are you a GIS student in Canada or United States? Below is a list of 5 prominent applications of GIS in urban planning that you can use for your GIS dissertation/ thesis or capstone projects.
➔ Land Use Planning
Students can use GIS to analyze and amend state zoning laws. We assisted a Brazilian student to write a dissertation proposing land use changes, little did they know it’d find a way to the heart of government policy! SUBSCRIBE now to enjoy top-of-the-table land use planning homework help!
➔ City Traffic Planning
Using GIS to model traffic flow and to design public transit routes, our previous clients have made footprints in UAE, Canadian, American, and European city transportation planning and management. Go on, PLACE AN ORDER and enjoy massive 2025 discounts!
➔ Environmental Management
In an era of “Going Green” and sustainable environmental management, our professional GIS consultants are willing to share their experience to students. Analyze urban green spaces, pollution levels, or climate change impacts in your coursework like a pro you’ll soon become! Contact Us TODAY for GIS assignment help in environmental management.
➔ Disaster Preparedness
What if the city planners in Los Angeles had been our alumni? Maybe, just maybe, our GIS experts would have conducted better risk assessment and emergency planning to avert the inferno. From Manila to urban centers located within ‘The Ring of Fire,’ you’re a CLICK away from support with GIS disaster management projects!
➔ Smart Cities
Explore IoT and GIS integration for futuristic urban planning like your counterparts involved in the legendary Dubai Smart City. Now that the Emirates one has been built, be a part of the next one in your region!
Check out the full list of our ArcGIS coursework assistance services here.
Other Applications of GIS in Urban Planning and City Management
Other functions of GIS in urban planning and city management include:
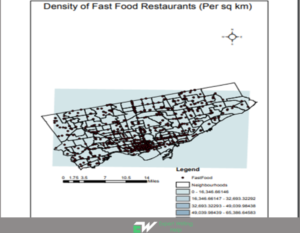
#1: GIS urban planning integrates and overlays multiple geospatial data layers e.g. zoning regulations, tectonic movement indicators, and population density to identify possible conflicts, geological patterns, or hotspots allowing for composite spatial analysis.
#2: City planners use GIS to track the location and condition of infrastructure such as roads, public utilities, and buildings. Infrastructural management prioritizes maintenance activities and isolates facilities requiring upgrades.
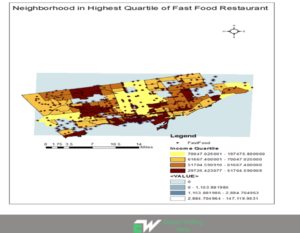
#3: Creating interactive maps that visualize urban dynamics in areas that need targeted interventions. GIS allows planners to visually represent urban trends like crime rates, population growth, and traffic patterns in real time. GIS-based planners share pertinent data with resident associations during public participation exercises to gather community input for every proposed project.
Specific Applications of GIS Techniques in Modern Urban Planning
Urban planners allocate proportionate resources using GIS-based conclusions that target the right populations after pinpointing the most prime location for such developments. Among the many activities of a GIS professional in urban planning and management are mapping, geospatial information analysis, and data visualisation & modelling. They do this through:
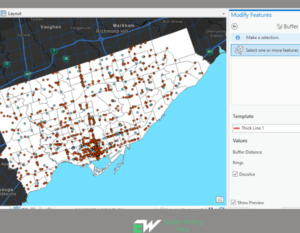
- Identifying suitable development sites after analyzing factors like proximity to other services, land availability, ergonomic regulations, or environmental suitability.
- Conducting impact assessment (social and environmental) for proposed projects to comply with municipal estate restrictions.
- Tracking land use changes and monitoring urban growth patterns over time to establish city sections with rapid development needs.
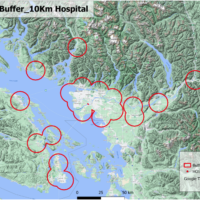
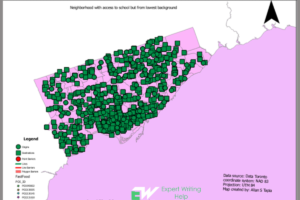
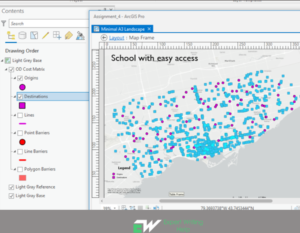
- Creating equitable access to social services in underserved areas through investments in essential services such as building healthcare, sanitation amenities, and educational institutions.
Fun Fact: The helmets different GIS scientists wear distinguishes their profession. See the image below and tick where you belong…
A chart depicting color codes for helmets and their respective reflective jackets (Source: PosterMyWall).
Reasons GIS Techniques are Integral in Urban planning
- Unending cases of severe traffic congestion (rush-hour New York, is that you? Haha!)
- Inadequate access to essential services leading to the growth of densely-populated slums and unplanned informal settlements that lack basic sanitation and infrastructure. Poor public health, inadequate water and sanitation, and absence of recreational parks are detrimental to city dwellers’ well-being.
- Closely related to (2) above, poor planning and segregation leads to social exclusion / marginalization of whole communities. There’s evident disparity in access to quality housing, education, and healthcare between different socioeconomic groups.
- Poor urban planning directly leads to high cost of living. For example, housing prices rise due to limited developable land which is in very high demand.
- Environmental degradation and habitat loss, maturing into the dreaded ‘Urban Heat Island Effect.’ No wonder certain towns have higher urban temperatures ~ what with the lack of green spaces and excessively paved surfaces?
- Cities planned without GIS face an increased risk of disasters. Fortunately, GIS software like QGIS or Google Earth Engine and datasets such as OpenStreetMap or NASA Earthdata can help alleviate this.
Important Factors to Consider in your GIS Dissertation Project in Urban Planning
- Data quality, accuracy, and reliability heavily influences the meaningfulness of your GIS analysis.
- Engage the community and involve stakeholders throughout the planning process by providing accessible GIS data tools.
- Technical expertise ~ only skilled GIS professionals should manage or analyze complex spatial data.
What Future GIS Students Should Watch Out For
In 2025 and beyond, keep an eye out for the following:
- AI and Machine Learning will be integrated into GIS for predictive analytics.
- Real-Time GIS applications in smart cities and IoT.
- Open Data, Crowdsourcing, and the growing importance of community-generated data will take center-stage.
- 3D GIS and Virtual Reality are emerging tools for visualizing urban environments and their time is now!
Common Challenges Students Face While Using GIS
- The learning curve for GIS software e.g. ArcGIS and QGIS is quite techy for most students.
- Finding accessible, reliable and affordable spatial data for GIS academic projects is a notorious uphill climb.
- Balancing GIS projects with hard coursework, lectures, and still remaining with me-time is one hell of a migraine you don’t want to risk!
Useful resources for students struggling with GIS homework and projects
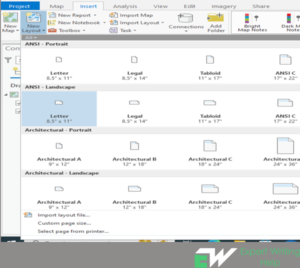
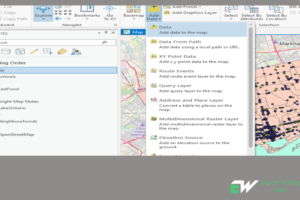
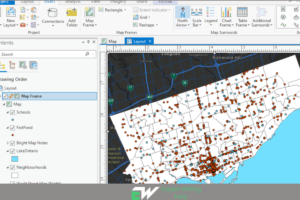
How To Create Map in ArcGIS Pro
Learn 10 Epic Difference Between ArcGIS and QGIS
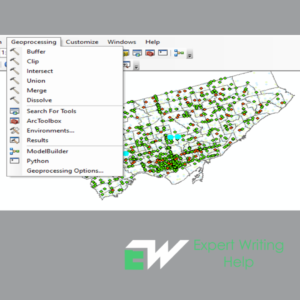
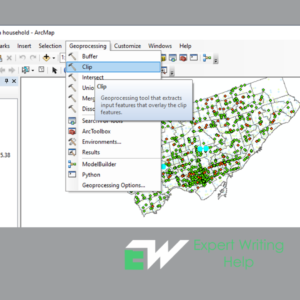
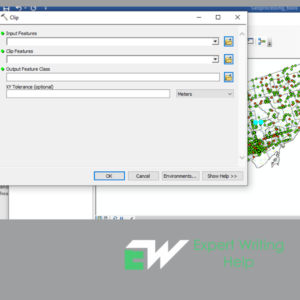
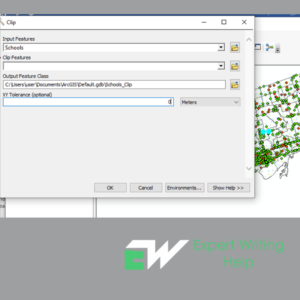
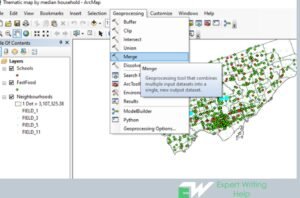
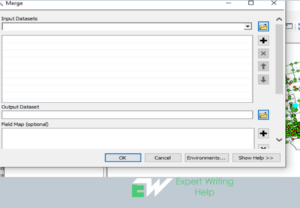
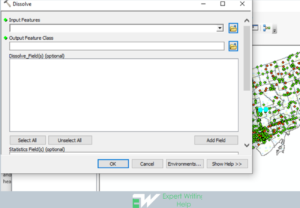
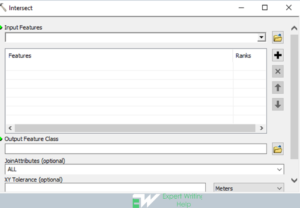
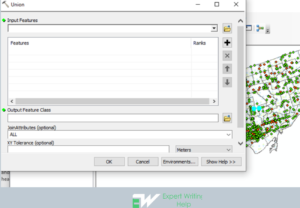
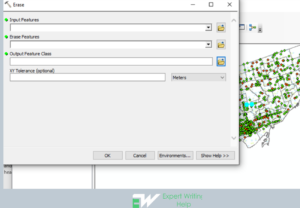
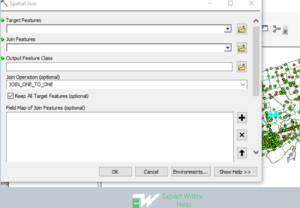
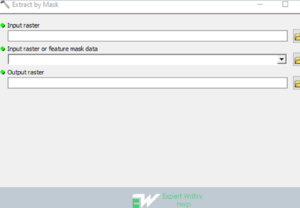
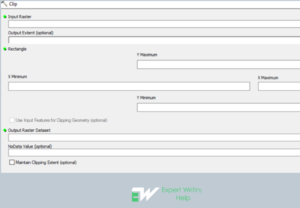
16 Geoprocessing Tools To Use In GIS Homework Like GIS Pro
Practical Solution: To overcome the above challenges, Expert Writing Help is on the other end of the line 24/7/365 with discounted online GIS assignment writing assistance, tutorials, and unlimited access to authoritative data sources. We deliver A+ quality papers way before the submission deadline, avoiding unnecessary clashes with serious GIS faculty!


 With scientist working around the clock to minimize the spread and also try and get a cure for the novel disease, Corona Virus, or as many of you will call it, Covid-19, they need help from every available channel and geographical data analyst have risen to the task once again to help and show them in a simplified version how the virus is spreading. So what is GIS technology? What is its relevance in relation to the Corona Virus? GIS technology is basically the collection, analyzing, manipulation and representation of spatial and geographic data as deemed relevant according to the set criteria. In our previous segment, we analyzed a couple of software that have been tested and proven time and again to be the best GIS program every GIS analyst should learn. However, amid this pandemic, how do these systems help us and what role are they playing in making sure that the human race overcomes this terror? Well, this is how. Our
  The world health organization is at the front line in helping fight this pandemic and they are doing the best they can in collaboration with both the affected countries and those that are not yet infected. Having in mind that they have this tasks in hand, they have also adopted a GIS system that assists them to get live updates of what is happening in terms of the cases being reported all over the globe. They are able to update their systems every 15 minutes with the latest news in terms of the spread and research on Corona Virus. GIS analysts have come up with a global map that shows the extent to which every country has been affected by the virus. However, the good thing is that they do not reveal the specific identities of the affected individual.